Capstone Project, Google Data Analytics certification
How Can a Wellness Technology Company Play It Smart?
Introduction
Welcome to my Bellabeat data analysis case study! As a junior data analyst, I will take on many real-world tasks in this project. I’ll imagine myself working for Bellabeat, a high-tech manufacturer of health-focused products for women, collaborating with different characters and team members. To answer key business questions, I’ll follow the steps of the data analysis process: ask, prepare, process, analyze, share, and act. Along the way, I’ll use the Case Study Roadmap tables, which include guiding questions and key tasks, to ensure I stay on track.
Project Scenario
Bellabeat is a wellness-focused company that offers innovative health and lifestyle products. It blends technology and natural design to empower women to track their well-being. Although Bellabeat has been successful as a small company, it has the potential to become a more significant player in the global smart device market.
Bellabeat’s smart devices products track user data. The task is to analyze this data to understand how consumers use their smart devices. The insights discovered will help guide the company’s marketing strategy.
Product Bellabeat offers
Bellabeat Leaf:
A stylish health tracker worn as a bracelet, necklace, or clip. Target audience: Women seeking a holistic and fashionable wearable health tracker.
Bellabeat Spring:
A smart water bottle designed to help users stay hydrated. Target audience: Individuals who want to maintain proper hydration as part of their wellness routine.
Bellabeat App:
A mobile app that integrates with Bellabeat devices to provide a centralized health dashboard. Target audience: Users of Bellabeat products, providing them with a complete wellness ecosystem.

Bellabeat Ivy:
A smart bracelet designed for advanced health tracking. Target audience: Women looking for an elegant yet comprehensive health monitoring solution.
Bellabeat Coaching:
Personalized coaching services are offered through the Bellabeat ecosystem. Target audience: Women seeking guided support for achieving health and wellness goals.
STEP 1: Ask
Business task:
Analyse user behavior and health data to uncover usage patterns and behavioral insights, enabling Bellabeat to develop data-driven marketing strategies and product improvements. The goal is to increase customer engagement, drive sales, and strengthen Bellabeat’s position in the wellness technology market.
Key Stakeholders:
Bellabeat Leadership Team: Oversees strategic decisions and business growth.
Marketing Team: Utilizes insights to create targeted campaigns and improve outreach.
Product Development Team: Applies findings to enhance product features and user experience.
Data Analytics Team: Responsible for extracting insights from user data and ensuring analysis accuracy.
Customers: End-users whose feedback and behavior are central to shaping products and services.
STEP 2: Prepare
Data Description:
The data set, sourced from FitBit Fitness Tracker Data (CC0: Public Domain), contains fitness and activity data collected from 30 Fitbit users who consented to share their minute-level personal tracker information. It includes key metrics such as daily activity levels, steps, heart rate, and sleep monitoring, providing insights into users’ physical activity and lifestyle habits. However, the data has limitations regarding sample size and user diversity, which may affect the generalizability of insights.
Data provided in Kaggle: FitBit Fitness Tracker Data
Observations:
- Data is granular, with minute- and second-level details.
- Both datasets include similar metrics (e.g., steps, calories, heart rate), but the second dataset expands coverage.
- Wide-format files (e.g., minuteCaloriesWide) offer an alternative view for aggregate analysis.
- There is no age or gender segmentation.
Credibility assessment:
Evaluating the dataset’s credibility involves considering several factors:
- Reliability: The dataset includes data from 30 users, a relatively small sample size. This limited scope may not comprehensively represent the broader population’s fitness behaviors.
- Originality: The data was collected via third-party sources, specifically through Amazon Mechanical Turk, which may introduce variability in data collection methods.
- Comprehensiveness: While the dataset offers detailed minute-level data across various health metrics, the small sample size and potential inconsistencies in data recording can affect the depth of insights.
- Currency: The data was collected between March and May 2016, making it outdated. User habits and technology have evolved since then, potentially limiting the relevance of the findings.
- Citation: The dataset needs more detailed information about the data collection process and participant demographics, which can impact the transparency and reproducibility of analyses.
STEP 3: Process
For this project, I selected Excel, SQL, and Tableau because each tool provides unique strengths in data analysis, processing, and visualization. Excel allowed me to quickly clean and explore the dataset, handling tasks like removing duplicates and creating pivots for initial insights. SQL provided the power to process and aggregate large datasets efficiently, ensuring data accuracy and scalability. Finally, Tableau enabled me to transform the processed data into interactive, visually engaging dashboards, making patterns and trends easy to communicate.
Relevant data:
The data I’m working with includes key metrics such as Total Steps, Very Active Minutes, Calories, Total Minutes Asleep, Total Time in Bed, and Sedentary Minutes, aggregated by user ID and activity date. These metrics are relevant because they provide a comprehensive view of users’ physical activity levels, sleep patterns, and energy expenditure, which are crucial for understanding wellness behaviors.
- Total Steps and Very Active Minutes: These highlight users’ activity levels and intensity, helping to identify correlations and opportunities for healthier habits.
- Calories: This metric, along with steps, helps analyze monthly trends and energy expenditure, offering insights into how users’ activity impacts their overall wellness.
- Sleep Metrics (Minutes Asleep and Time in Bed): These are critical for evaluating sleep efficiency and patterns, allowing tailored recommendations for improving rest.
- Sedentary Minutes: This metric reveals inactivity patterns and their relationship to other wellness indicators, such as sleep and calories burned.
By leveraging these data points, I can identify trends, outliers, and correlations that support actionable recommendations to improve user engagement, physical activity, and overall health.
For this project, I selected Excel, SQL, and Tableau because each tool offers unique data analysis, processing, and visualization strengths. Excel allowed me to quickly clean and explore the dataset, handling tasks like removing duplicates and creating pivot tables for initial insights. SQL provided the power to process and aggregate large datasets efficiently, ensuring data accuracy and scalability. Finally, Tableau enabled me to transform the processed data into interactive, visually engaging dashboards, making patterns and trends easy to communicate.
Data Processing in Excel:
I used Excel to clean high-level data, check missing values, validate format consistency, and remove duplicates. Relevant files to use from both datasets are dailyActivity Merged. These files summarize daily activities, such as steps, calories, and sedentary minutes, which align with the business objective of analyzing fitness trends. I provide snapshots of the Excel results.
Commands and functions:
- Merged files: copy-paste, and make sure column headers are identical.
- Check for missing values: used COUNTBLANK().
- Fix formatting issues: Short Date for date consistency, numeric columns, remove duplicates, aggregate data.
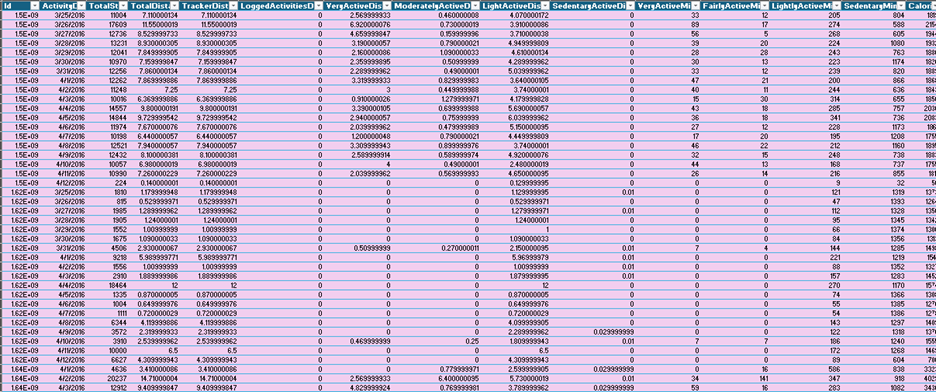
Check for non-numeric values
Checked with conditional formatting highlining cells greater than or equal to zero. Identify cells with invalid data, such as text or negative numbers. All columns contain numeric values.
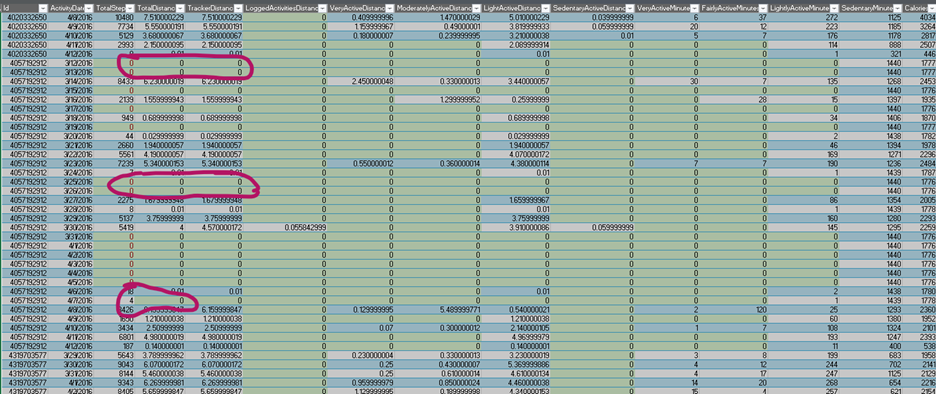
Identify zero values
Checked with conditional formatting highlining equal to zero. Made assumptions for zero values as valid. It is possible to engage in sedentary or light activity without significant distance (further to validate).
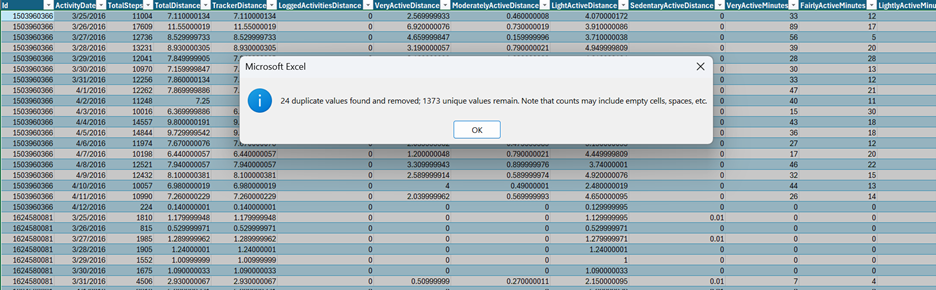
Remove duplicates
Exploring duplicates with ID and Activity date, I found there were 24 duplicates. Since there is not a timestamp for the activity, there is no way to differentiate between multiple sessions on the same day. I will leave the 24 records since they could still provide useful information such as variation in activity throughout the day or patterns in high vs low-intensity exercises.
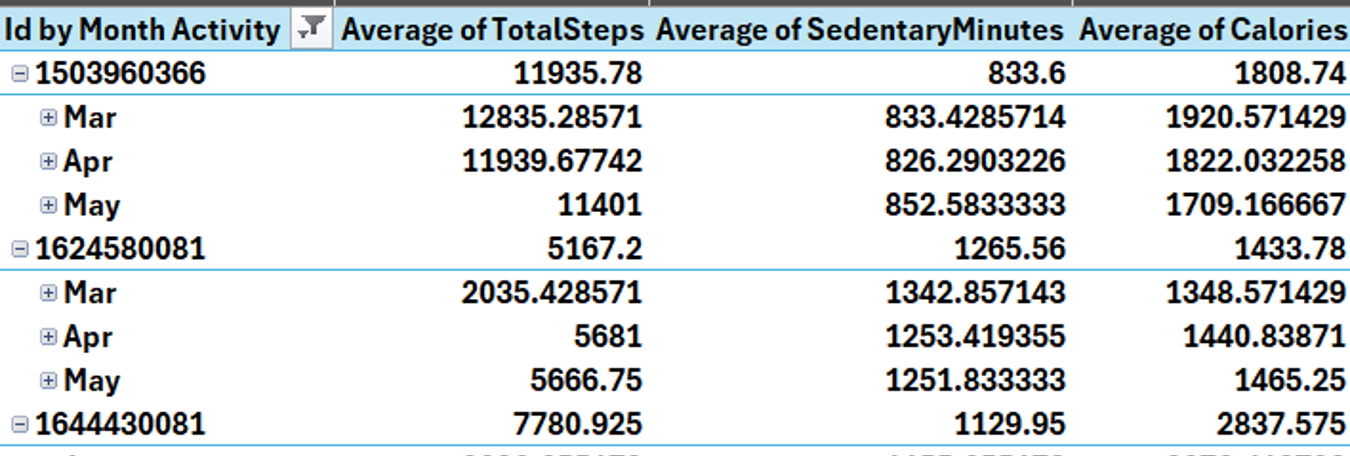
Pivot table 1: Aggregate data
A Pivot table focused on averages to analyze typical user behavior for generalized insights using average steps, calories and sedentary minutes for each ID and ActivityDate.
Data Processing in SQL:
Further Bigquery Analysis:
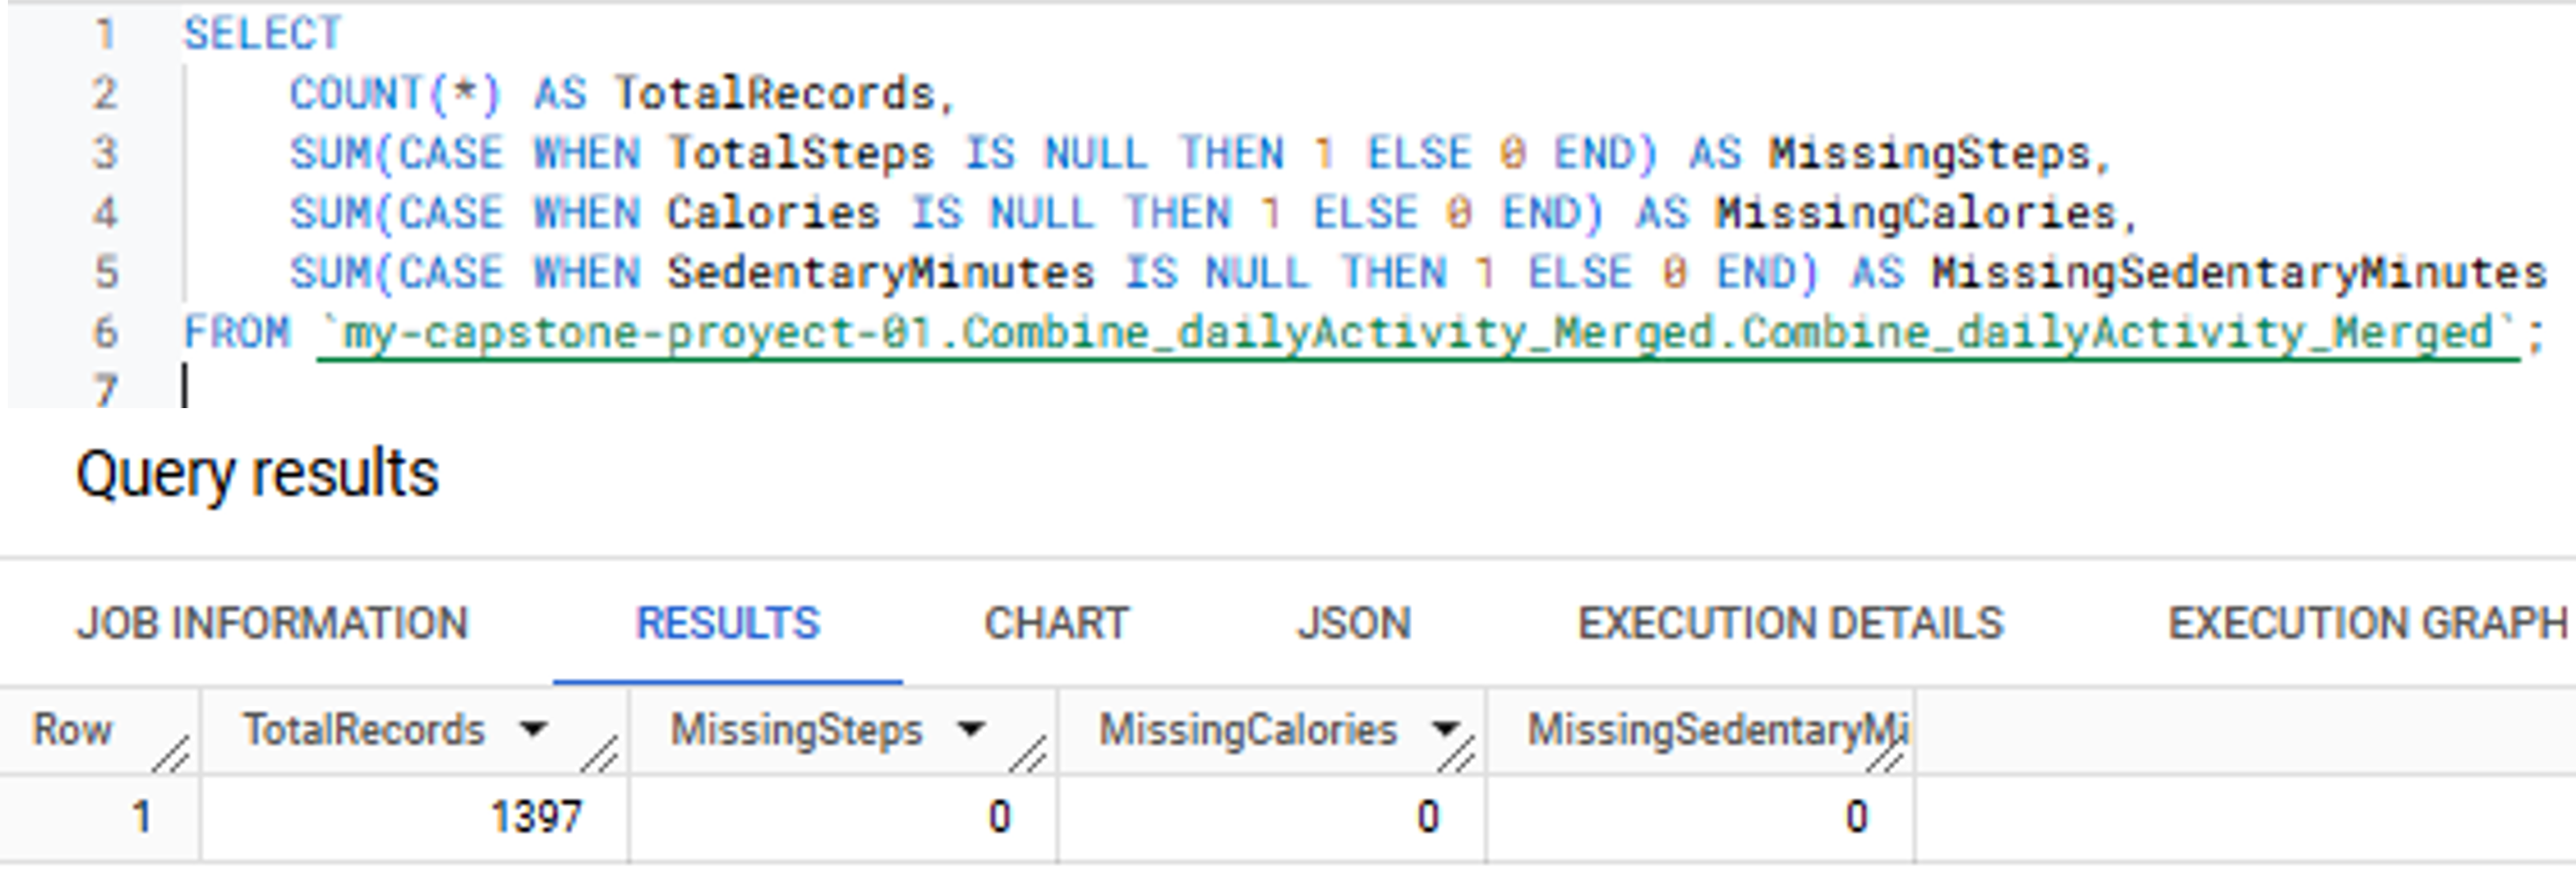
Load combined dataset in BigQuery
The data set is Complete, with no missing data.
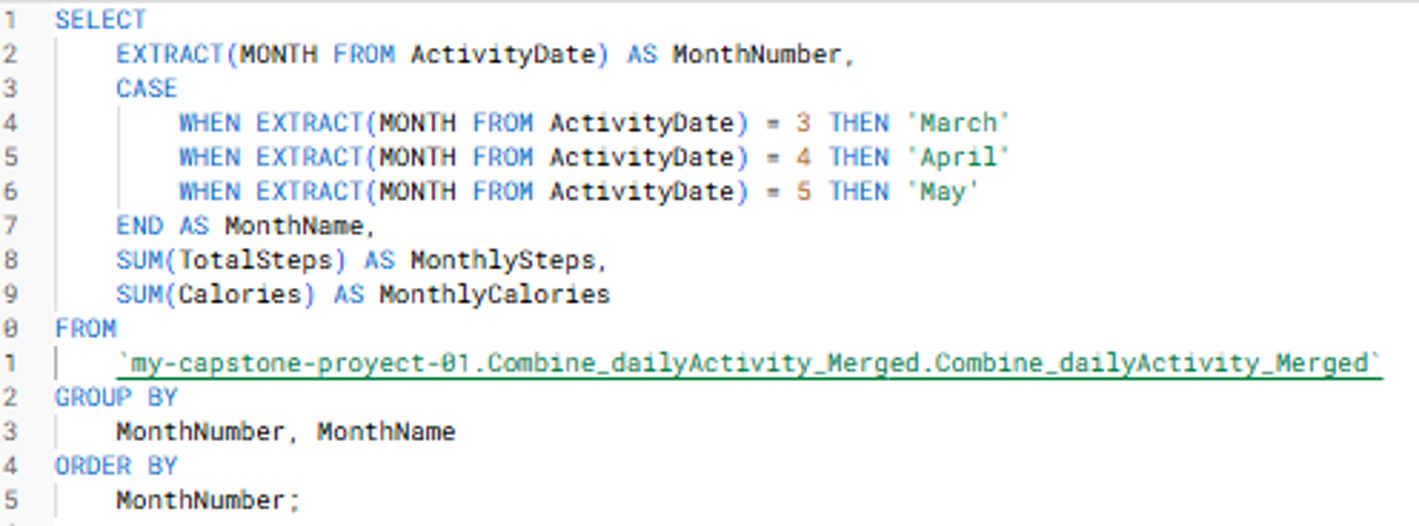
Group steps and Calories by month
Examine the relationships between steps taken and calories burned.
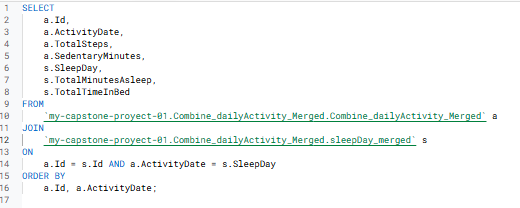
Aggregate granular data
Joined Combined dailyActivity with sleepDay merged. Examine minutes asleep and time in bed.
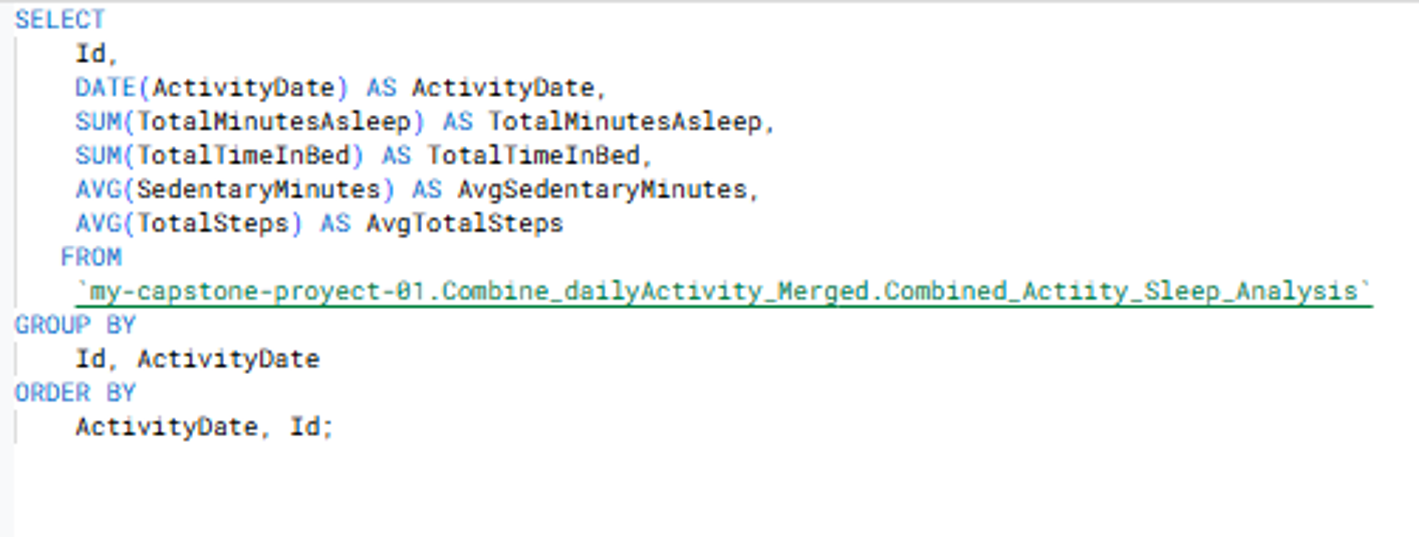
Group, sums and averages
Group by Id and Date to examine total min asleep, total time in bed, average sedentary min and ave totalSteps
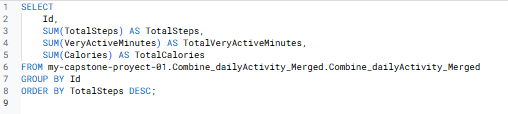
Agregate data to take to Tableau, Steps vs Active minutes
Add total steps, active minutes, and calories. Grouping by ID and sorting descending by total steps.
STEP 4: Analyze and Share
From Excel, Pivot Table:
This pivot table aggregates data by user ID and breaks it down further by month (March, April, May).
This data provides a foundation for understanding user activity trends, such as:
- Activity consistency across months.
- Levels of sedentary behavior and its correlation with calorie burn and steps.
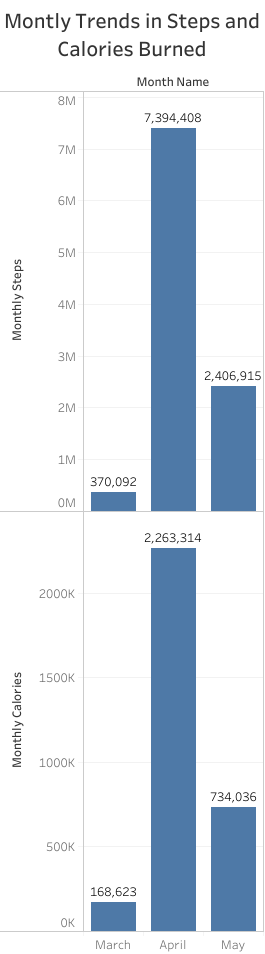
Monthly trends in Steps and Calories Burned
This chart presents the total monthly steps and total calories burned for the months of March, April, and May
Analysis:
Trends in Steps:
March: Only 370,092 steps were recorded. This could indicate limited participation or activity tracking for this month.
April: A dramatic increase to 7,394,408 steps, showing significantly higher engagement or activity during this period.
May: Steps dropped to 2,406,915, but the total remains considerably higher than in March.
This trend suggests peak activity in April, followed by a decrease in May. The factors driving the higher activity in April could include weather changes, fitness challenges, or tracking inconsistencies in March.
Trends in Calories Burned:
March: Total calories burned are 168,623, aligning with the low activity in steps for this month.
April: Calories burned rise sharply to 2,263,314, correlating with the increased steps.
May: Calories burned drop to 734,036, mirroring the decrease in steps compared to April.
This close correlation between steps and calories burned demonstrates a strong relationship between activity levels and energy expenditure.
Overall Correlation:
The data reveals that as steps increase, calories burned also increase. This indicates that tracking physical movement (steps) effectively reflects energy expenditure, providing actionable insights for stakeholders aiming to monitor activity levels.
Observations on Data Participation:
The sharp difference in March’s data compared to April and May may indicate that fewer users were active or tracking their steps during March.
Encouraging more consistent tracking or participation during months with low engagement could help smooth out trends and improve analysis.
Insights to consider for business objectives:
To help Bellabeat target trends for wearables:
-
- Activity and Behavior Patterns:
- Identify users with consistent high activity to model aspirational behaviors.
- Analyze low-activity users (like 2891001357) to uncover barriers to increased activity.
- Sedentary Trends:
- Focus on high sedentary users to highlight the importance of reducing sedentary time through active reminders.
- Seasonal Behavior:
- Variations between months may suggest seasonal or environmental influences on activity. E.g., Some users show a decline from April to May.
- Outliers and Marching Behavior:
- Validate assumptions regarding marching (steps without distance). Check whether it’s valid for sedentary calorie burns or is noise.
- Activity and Behavior Patterns:
Recommendations:
- Focus on April: Analyze the reasons for the significant increase in steps and calories burned in April. It might involve seasonal influences or fitness events.
- Increase Engagement in March and May: Encourage consistent tracking and activity through challenges or motivational campaigns during months with lower activity.
- Segment the Data Further: Analyze steps and calories for specific user groups (e.g., by age or gender) to identify trends or outliers.
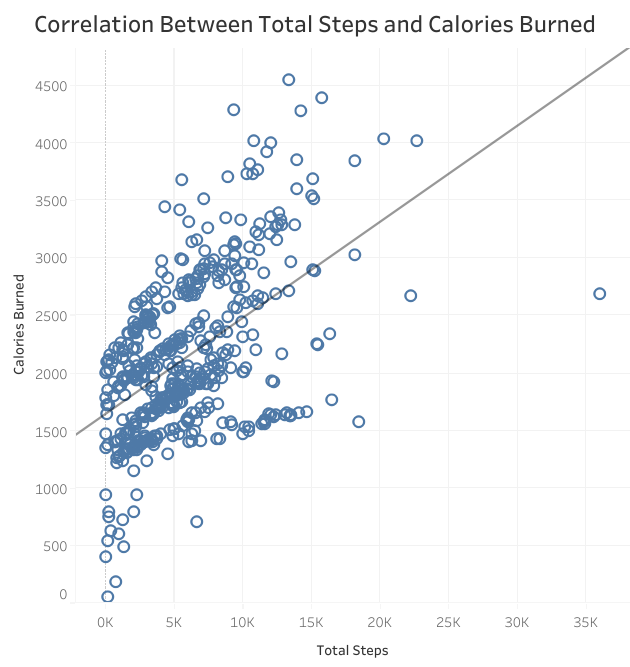
Analysis:
- Positive Relationship:
The upward-sloping trend line confirms that higher step counts generally correspond to higher calorie expenditure. This supports the idea that physical activity (steps taken) directly influences calorie burn.
- Data Distribution:
Most data points cluster between 0–15K steps and 1,500–3,000 calories burned. This indicates that most users are moderately active with a typical calorie burn range.
- Outliers:
A few points with high calories burned but low steps could represent users engaged in activities other than walking (e.g., strength training or cycling).
Conversely, there are rare points with high steps but lower calories, suggesting lighter-intensity activities (e.g., walking rather than running).
Insights and Recommendations:
1. Consistency in Steps and Calories: Users with consistently higher step counts tend to have a corresponding increase in calories burned.
2. Engagement Opportunity:
Encourage users to increase their step count through challenges or reminders to maximize their calorie expenditure.
Highlight the role of active minutes and exercise intensity, which can further boost calories burned.
From Combined Datasets in SQL:
The combined dataset with sleepDay merged was loaded into Tableau as a CVS file.
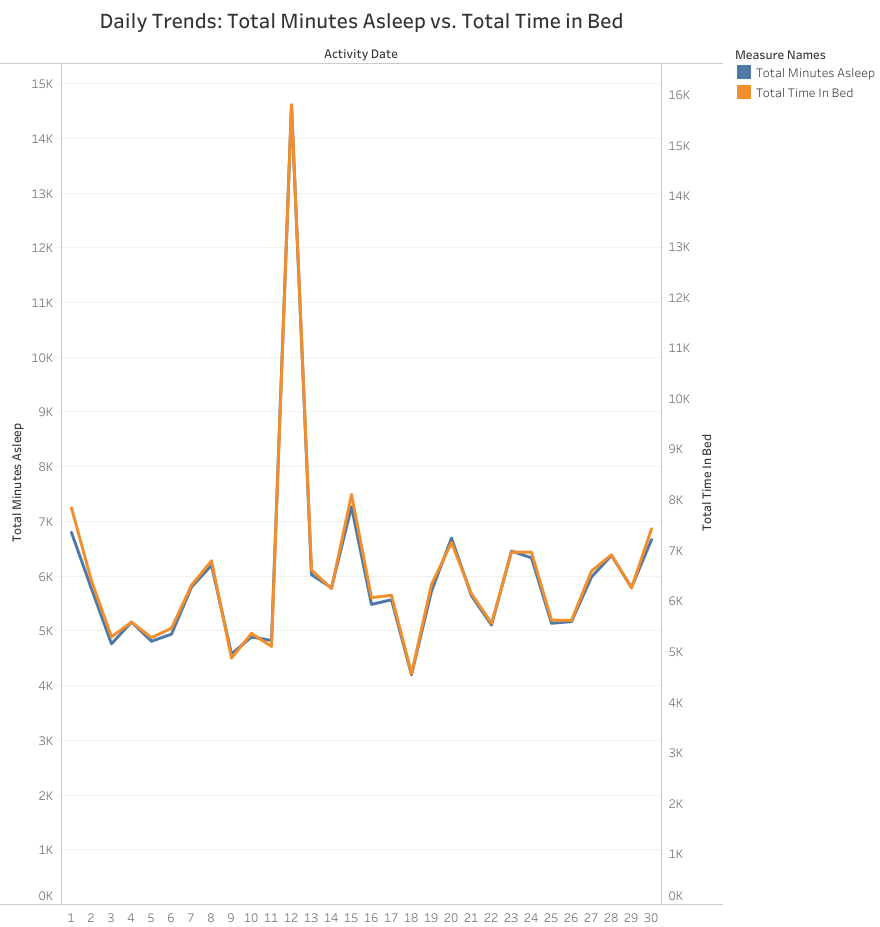
Analysis:
- Daily Trends:
There’s a clear correlation between Total Minutes Asleep and Total Time in Bed (lines almost overlap).
A significant spike appears around the 12th day. This could indicate an anomaly or exceptional condition (e.g., an outlier or unusual sleep pattern).
- Consistency:
Most days, the two measures (sleep and time in bed) are closely aligned, but occasional gaps suggest that some users might have been in bed but not fully asleep.
- Variation:
After the spike on the 12th day, both values decrease and fluctuate consistently, showing variability in sleep behavior.
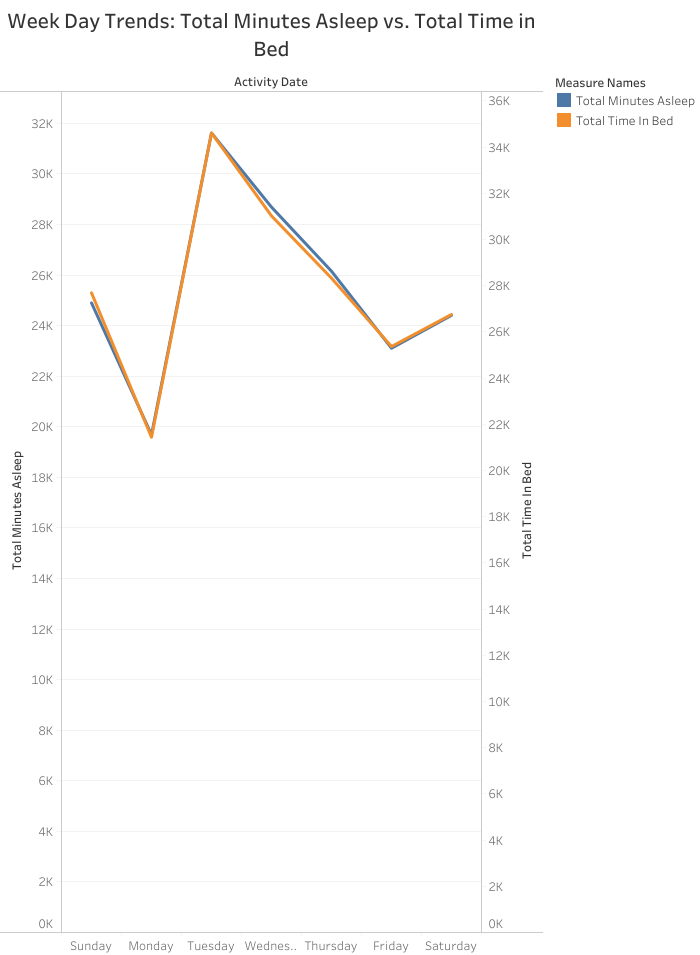
Analysis:
Sleep patterns change significantly based on weekdays.
Insights:
-
- Tuesday shows the highest total minutes asleep and time in bed. This may indicate that users recover sleep from the start of the week (possibly Monday’s shorter sleep duration).
- Monday has the least amount of sleep and time in bed, suggesting busier routines or less rest after the weekend.
- Sleep totals decline consistently from Tuesday to Friday and recover slightly on Saturday.
Recommendations:
Engagement Opportunity:
Encourage users to set daily steps goals using the Bellabeat app to minimize the weekday sleep gap.
Create weekend wellness programs to highlight the importance of recovery sleep.
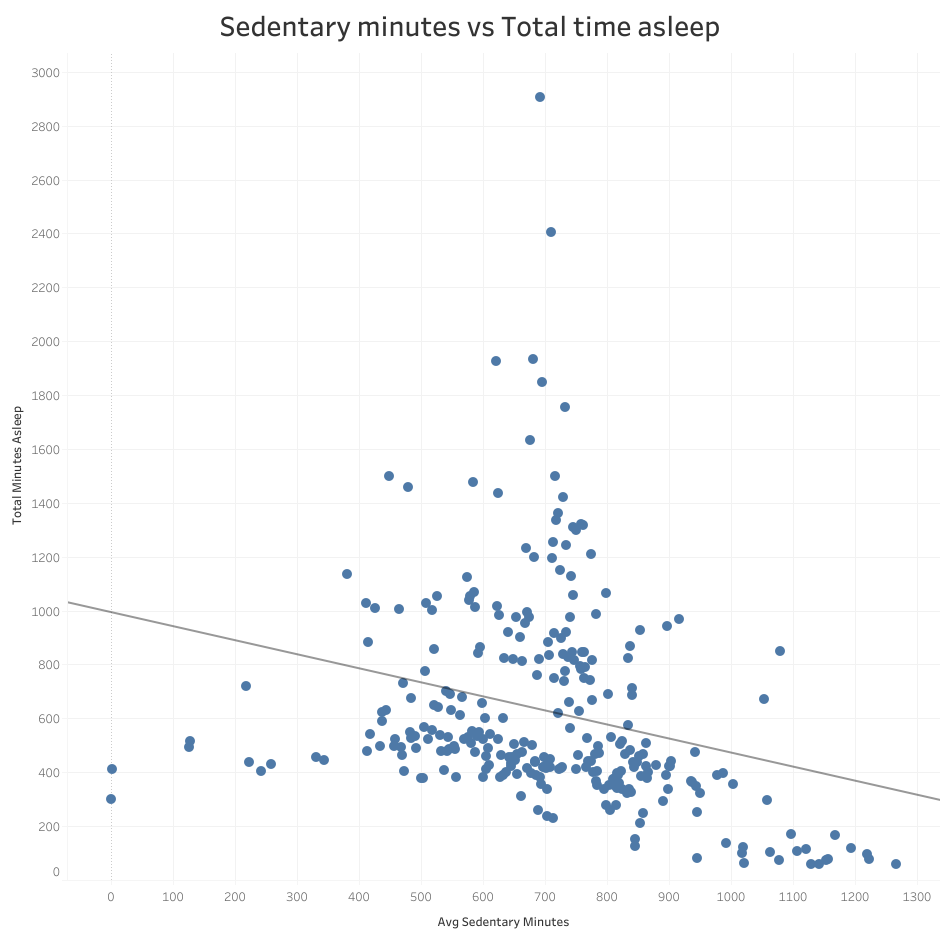
Analysis:
- Trend Observation:
Cluster Density: Most data points are concentrated between 400 to 800 sedentary minutes and 200 to 500 minutes asleep.
No Strong Linear Correlation: The points are spread widely without a clear linear trend. This indicates that more sedentary time doesn’t necessarily correlate strongly with sleep duration.
- Negative Correlation:
The trend line slopes downwards, indicating a slight negative correlation between Avg Sedentary Minutes and Total Minutes Asleep.
This suggests that higher sedentary minutes are generally associated with lower total minutes asleep.
- Spread of Data:
While there is a trend, the data points are widely scattered, meaning there is significant variability.
Many individuals with high sedentary minutes (e.g., 700–900) still have varying sleep durations.
- Outliers: A few data points show exceptionally high “Total Minutes Asleep” (over 1500), which might indicate special cases like illness or abnormal activity patterns.
Recommendations:
Engagement Opportunity:
Set activity goals for user with high sedentary time to maintain a balance between movement and restfull sleep.
Identify users with unusually hight sleep durations and suggest tracking their sleep patterns more accurately or adjusting their tracking habits.
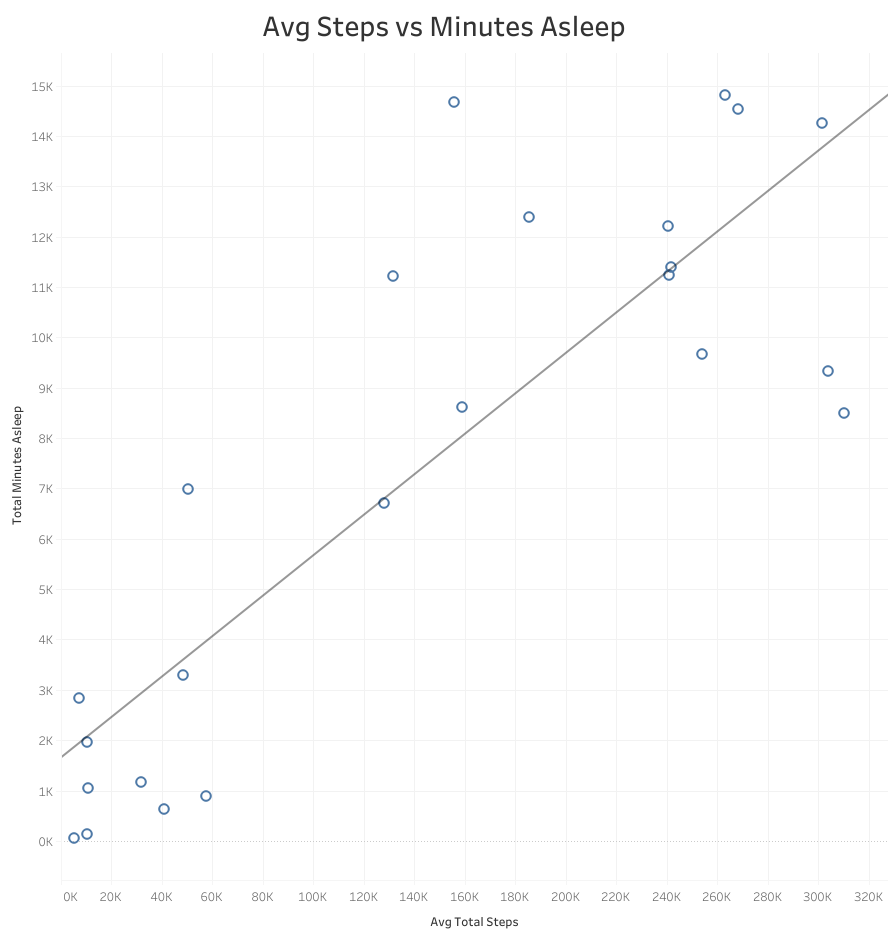
Analysis:
- Positive Trend:A slight positive correlation seems to exist between average total steps and total minutes asleep.Individuals with higher steps tend to have higher sleep minutes, though the pattern is not linear.
- Clustering:Higher steps (200K–300K) generally align with higher sleep minutes (~10K–15K).In contrast, individuals with low step counts (below 50K) show significant variation in sleep duration, with many clustered at low sleep minutes.
- Outliers:A few outliers have high sleep minutes (~14K) despite moderate total steps (~150K).These points may require further investigation into factors such as rest periods or reporting inconsistencies.
- Lower Step Counts:Individuals with fewer than 50K steps generally have lower total sleep minutes (~0–4K), which could indicate lower activity levels aligning with lower sleep quality.
Recommendations:
Engagement Opportunity:
For users with low steps but high sleep, recommend moderate-intensity exercises to balance activity and rest.
Provide hygiene tips for users who take many steps but get little sleep to ensure their activity doesn’t interfere with rest.
Encourage all users to meet minimum benchmarks, such as 10,000 steps per day and 7 hours of sleep per night.
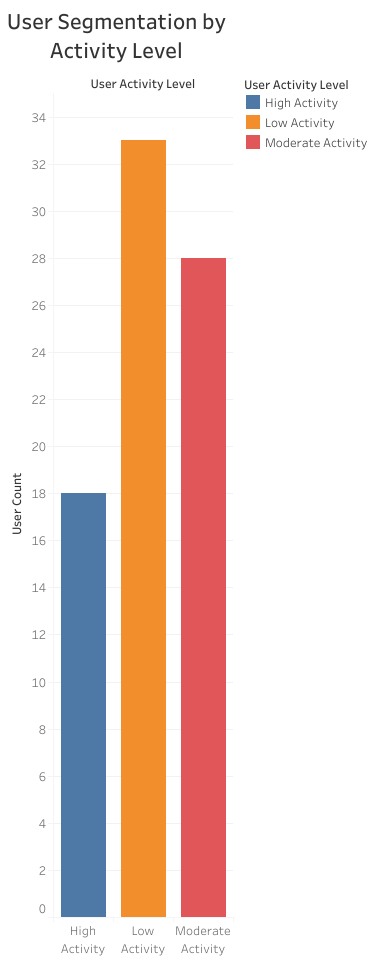
Low activity: less than 5,000 steps
Moderate activity: 5,000 to 10,000 steps
High Activity: greater than or equal to 10,000 steps.
Analysis:
Low Activity Dominates:
The Low Activity segment has the highest number of users, significantly outnumbering the other two categories.
This suggests that most users do not reach the recommended 5,000 steps daily.
Moderate Activity:
The Moderate Activity segment (5,000–10,000 steps) has fewer users than the Low Activity group but more than the High Activity group.
This indicates that while some users are moderately active, there’s room for improvement to shift them into the high-activity range.
High Activity Users Are Few:
The High Activity segment (10,000+ steps) has the fewest users, highlighting an opportunity to promote higher engagement and physical activity.
Recommendations:
Engage Low Activity Users:
Target this group with personalized challenges, reminders, or incentives to encourage them to increase their daily steps.
Example: App notifications or campaigns promoting “5K Steps a Day” challenges.
Encourage Moderate Users to Advance:
Users in the Moderate Activity range can be nudged toward the High Activity level through fitness campaigns.
Example: Introduce rewards for achieving 10,000 steps/day consistently.
Reward High Activity Users:
Recognize and reward high-activity users to maintain their motivation and encourage them to use Bellabeat products for continued progress.
Promote Active Minutes:
Combine step count data with active minutes (e.g., Very Active Minutes) to better understand the exercise habits of each group and encourage intensity-based workouts.
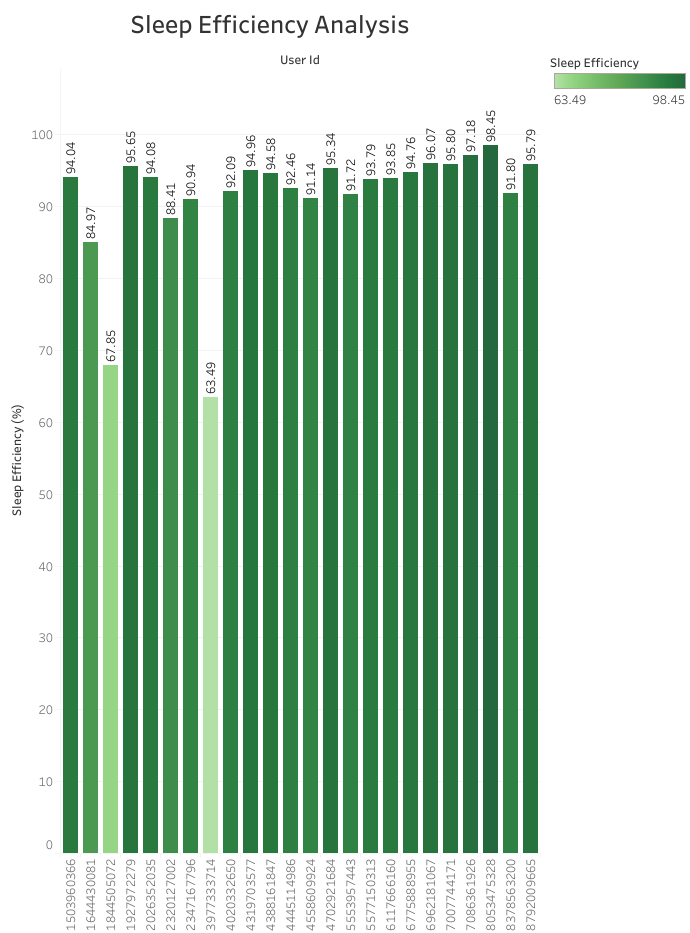
Analysis:
High Sleep Efficiency (Top Performers):
Many users have a Sleep Efficiency above 90%, with the highest being 98.45%.
This indicates that these users are spending most of their time in bed asleep, suggesting good sleep habits.
Top Users with High Efficiency:
User ID 708631926 (98.45%)
User ID 8053475328 (97.18%)
User ID 6962181067 (96.07%)
Low Sleep Efficiency (Areas for Improvement):
A few users show low sleep efficiency, with values below 70%. The lowest is 63.49%, meaning they spend significant time in bed not sleeping.
Users with Low Efficiency:
User ID 3977333714 (63.49%)
User ID 1844505072 (67.85%)
Insight:
These users may experience sleep disturbances or spend more time in bed awake (e.g., due to poor sleep hygiene, stress, or external factors).
Overall Trends:
There’s a noticeable gap between high-efficiency sleepers and low-efficiency sleepers, suggesting two distinct user groups:
Group 1: Efficient sleepers (90%+ efficiency).
Group 2: Users needing improvement (below 70%).
Recommendations:
Target Users with Low Sleep Efficiency:
Provide tips for improving sleep quality through the Bellabeat app (e.g., relaxation techniques, reminders to reduce screen time before bed).
Celebrate Top Performers:
Reward high-efficiency sleepers (90%+) to maintain motivation and engagement with the app.
Monitor Sleep Trends:
Analyze patterns over time to identify potential causes for low efficiency (e.g., weekdays vs. weekends, external stressors).
STEP 5: Act
Final Conclusion
The analysis reveals clear relationships between user activity, sleep patterns, and sedentary behavior, showing that higher physical activity correlates with better sleep efficiency and duration. However, many users fall into clusters with low steps, low very active minutes, and inconsistent weekday sleep patterns. These behaviors present opportunities for targeted interventions to improve user engagement, activity levels, and overall wellness.
How Bellabeat Can Apply These Insights
Target Low-Activity Users:
- Develop personalized challenges (e.g., step-count or active minutes goals) to encourage movement among users with low steps and sedentary behavior.
- Example: “10K Step Challenge” or “15 Minutes of Daily Intensity.”
Promote Consistent Sleep Habits:
- Launch app features or campaigns emphasizing consistent bedtime routines, especially during weekdays.
- Provide users with tips on improving sleep hygiene, such as reducing screen time and managing stress.
Reward and Retain High Performers:
- Recognize and reward users with balanced lifestyles (e.g., high steps, very active minutes, and consistent sleep).
- Offer badges, discounts, or exclusive wellness content to maintain their motivation and loyalty.
In-App Nudges and Education:
- Introduce in-app nudges, such as reminders to take breaks from sedentary periods or notifications to encourage better weekday sleep.
- Through interactive content, educate users about the link between physical activity and improved sleep.
Next Steps for the Team and Stakeholders
Enhance User Engagement:
- Incorporate insights into app features like step tracking, sleep reminders, and personalized notifications.
- Create gamified wellness challenges to motivate behavior change.
Focus on Segmentation:
- Segment users based on activity and sleep patterns to deliver personalized recommendations and programs.
- Example: Tailor tips for users with low activity vs. those with inconsistent sleep.
Develop Marketing Campaigns:
- Use the insights to design campaigns highlighting the role of Bellabeat products in achieving a healthy lifestyle.
- Example: “Move More, Sleep Better” campaigns targeting low activity and low sleep groups.
Monitor Progress:
- Track changes in user behavior after implementing recommendations to measure the effectiveness of interventions.
Complementary Data Suggestions
Demographics Data: Insights on user profiles like age, gender, and fitness goals could enhance the analysis. Consider surveys or external fitness studies.
Seasonal Data: Identifying how fitness trends vary by season or major events could add value.
Social Media Data: Engagement metrics for digital marketing alignment (e.g., Google Trends, Fitbit reviews).
Weight Data: The absence of weight and BMI data limits the ability to assess the impact of activity and sleep on weight management collected with surveys through apps (e.g., weight tracking in Bellabeat’s Leaf or Time products).
Dietary Habits:
Including data on users’ nutritional patterns could offer a holistic understanding of factors influencing activity and sleep.
Stress Levels:
Data on users’ stress levels would help analyze their impact on activity and sleep patterns.
Weather and Environmental Factors:
External variables like weather or seasons influence activity levels and sleep trends, providing deeper insights.
Summary
By leveraging these recommendations, Bellabeat can drive higher user engagement, improve wellness outcomes, and strengthen customer loyalty. The following steps involve refining app features, launching targeted campaigns, and expanding data collection for deeper insights into user behavior.
CLOSING REMARKS:
I chose this project because I am passionate about discovering trends in data to evaluate and define marketing strategies. It allowed me to engage in hands-on activities using various data analytics platforms, which I find both challenging and rewarding. Through this journey, I gained an immersive understanding of the practices and processes used by junior and associate data analysts in their day-to-day work.
This project helped me build key analytical skills such as data cleaning, analysis, and visualization while honing my expertise in tools like spreadsheets, SQL, R programming, and Tableau. I learned how to clean and organize data for analysis, perform calculations, and create impactful visualizations and dashboards to communicate findings effectively. Additionally, I could practice AI-driven data analytics skills learned in Course 8, which provided innovative ideas for brainstorming, cleaning, and preparing data, further enhancing my knowledge of the tools covered in the program.
I am deeply thankful to Google for curating such a comprehensive program that allowed me to learn at my own pace. This certification has enriched my technical skills and boosted my confidence as I take the following steps in my data analytics career. I feel incredibly grateful for this transformative learning experience.
December 26-2024